With the rapid iteration of information and communication technologies such as the Internet, big data, cloud computing, and artificial intelligence worldwide, the digital economy is becoming an important force in reshaping the new ecosystem of global economic governance [1, 2]. This integrated industrial development model is not only crucial to achieving inclusive growth and sustainable development, but is also driving a reshuffling of the world economy and the emergence of a new global economic governance landscape [3– 6]. In the manufacturing sector, the application of smart manufacturing technologies presents unprecedented opportunities for businesses while also bringing new challenges.
Production process optimization aims to enhance efficiency, reduce costs, and minimize resource waste by improving and optimizing every stage of the production process [7]. Leveraging advanced technologies such as big data and artificial intelligence, smart manufacturing technologies can drive the intelligent and precise optimization of production processes, significantly boosting production efficiency and quality [8, 9]. Based on smart manufacturing technology, enterprises can achieve real-time monitoring, precise analysis, and intelligent optimization of production processes, thereby more deeply identifying potential issues in production processes and more accurately pinpointing areas for improvement [10– 13]. Therefore, introducing lean production and continuous improvement concepts, advocating full participation, and continuously optimizing production processes are important methods for promoting production process optimization [14– 16].
Additionally, smart manufacturing technology can help enterprises optimize the allocation and efficient utilization of production resources, enhance the flexibility and agility of production lines, and better respond to market changes and customer demands [17– 19]. These advantages make lean production have broader development prospects and application potential under the backdrop of smart manufacturing [20]. From the perspective of industry development trends, an increasing number of enterprises are beginning to combine smart manufacturing technology with lean production and gradually exploring more efficient and intelligent production methods [21– 24]. This not only helps to enhance enterprise competitiveness and market share but also injects new momentum into the industry’s transformation, upgrading, and sustainable development [25, 26].
As times evolve and society develops, management theories and practices are continuously validated and deepened in production and daily life. Therefore, scholars have conducted research on optimizing enterprise production processes and quality control under the backdrop of digital intelligence. Holmemo and Korsen [27] indicated that digital tools have centralized and planned characteristics, which are in significant conflict with decentralized production processes. Therefore, how to achieve coordination between intelligent manufacturing and lean production is a major challenge faced by enterprises in their long-term production processes. Hoellthaler, Braunreuther and Reinhart[28] emphasized that an extended lean production system based on digital technology ensures the efficient operation of enterprise production processes, enabling enterprises to maintain strong market competitiveness even when faced with complex product varieties, personalized demands, and flexibility objectives. Romero et al. [29] explored the development and application of lean production practices in the digital intelligence field, pointing out that smart manufacturing technology can detect and eliminate “physical waste” and “digital waste” phenomena in production processes, thereby optimizing production processes and improving production quality. Cifone et al. [30] investigated mechanisms for reducing digital waste in lean production practices, indicating that under the support of digital technology, the execution speed and precision of enterprise production systems are significantly enhanced, while management decision-making capabilities are also effectively improved. Dupuis and Massicotte[31] clarified the transformative impact of digital technology on production models for manufacturing enterprises and its role in enhancing employee capabilities, emphasizing the continuous advancement of digital lean production practices in addressing organizational hierarchical conflicts.
Valamede and Akkari [32] proposed an intelligent production solution combining lean production with data-driven methods. On one hand, it leverages intelligent technology to upgrade manufacturing processes, and on the other hand, it relies on lean production principles to optimize production processes, enabling enterprises to maintain high production efficiency in dynamically changing environments and intensely competitive markets. Powell et al. [33] pointed out that Industry 4.0 technologies and their associated cyber-physical production systems can optimize the production and operational methods of manufacturing enterprises. Therefore, it proposes integrating lean production practices with Industry 4.0 technologies to provide decision support for enterprise production management. Rossini et al. [34] examined the role of lean production management in the digital transformation process of manufacturing enterprises. Different forms of digital transformation models represent the degree of enterprise investment in lean production. With the support of Industry 4.0 technology, enterprises have gained the ability to plan for the present and future, thereby effectively enhancing enterprise performance. It can be observed that digital and intelligent technologies can significantly improve production efficiency and quality, while also promoting enterprise digital transformation and intelligent upgrading, thereby enhancing enterprise competitiveness and sustainable development capabilities. However, at present, there are few practical research results in this field, and research on related intelligent manufacturing methods holds significant potential.
This paper optimizes industrial production processes based on smart manufacturing technology. Existing data is preprocessed using methods such as data integration, missing value filling, and time sequence adjustment. An inter-class association rule algorithm based on the Apriori algorithm is then used to extract deep association chains between production processes from the preprocessed data. Subsequently, a dynamic optimization model for production processes based on a flexible neural tree network is established. Finally, an integrated multi-functional industrial production execution management system is designed and implemented. Different simulation experiments are designed for each functional module of the system. The system’s practical application effectiveness is also validated.
Data collection is the cornerstone of data-driven production optimization strategies. In a smart manufacturing environment, sensors, IoT devices, and intelligent monitoring systems on production lines continuously generate massive amounts of data. This data includes multi-dimensional information such as equipment status, production capacity, and quality indicators, forming a digital image of the production process. Through data collection technology, this information is aggregated in real time and undergoes data preprocessing to remove noise and outliers, ensuring data accuracy and integrity.
The next step after data collection is data analysis, which includes methods such as statistical analysis, machine learning, and deep learning. Through these technologies, enterprises can discover patterns and identify anomalies in the data to achieve real-time monitoring and analysis of the production process. For example, through machine learning algorithms, enterprises can perform predictive maintenance on equipment operating status, detect potential faults in advance, and avoid production interruptions. At the same time, by mining historical data, companies can identify bottlenecks and inefficient links in the production process, providing a reference for subsequent optimization decisions. Production process optimization based on data is the core component of a data-driven strategy. It uses the results of data analysis as a basis for fine-tuning and improving production processes. Through data analysis, companies can identify potential issues in the production process, such as resource waste and inefficient links.
During the production process, the automated control system uses sensors to collect various data in real time, such as temperature, humidity, and pressure, forming a data stream. Traditional automated control systems typically use fixed control algorithms for regulation, lacking adaptability to complex production environments. In contrast, intelligent optimization technology can analyze and learn from large amounts of data, continuously optimizing control strategies to achieve real-time monitoring and regulation of the production process. For example, in steel production, intelligent optimization technology can adjust steelmaking temperature and time in real time based on raw material composition and equipment status, ensuring product quality and production efficiency. Intelligent optimization technology can also enable predictive capabilities in automated control systems. By analyzing historical production data, intelligent optimization algorithms can predict future trends and changes in production processes, providing decision-making support for enterprises to prepare production plans and resource scheduling in advance. Predictive capabilities enable automated control systems to respond more flexibly to changes in market demand and fluctuations in production processes, enhancing the adaptability and response speed of production lines.
Through data preprocessing, the original complex historical data is processed to provide a higher quality dataset for subsequent algorithm analysis. For the processed data, strong association rules between links are obtained through association rules [35], and corresponding association chains are obtained.
Since historical data is not stored in a database, it is necessary to manually export data item by item. The exported data is scattered and irregular. To address the issue of scattered data, the data is consolidated.
For integrated data, there are many instances of missing values in data records due to various reasons, primarily caused by temporary shutdowns resulting from malfunctioning industrial product data collection equipment and human error during data synthesis.
For missing values, first analyze the data before and after the missing value in that segment. If the data shows an increasing or decreasing trend, use the arithmetic sequence method to fill in the missing values. If there is no obvious trend, use the mean method to fill in the missing values, i.e., calculate the mean of the values before and after the missing value.
Treat the data from each stage as time series data and calculate the influence relationships and influence sequences between the stages. At this point, two adjustments need to be made to the dataset: horizontal and vertical. Horizontal adjustment involves calculating the sequence of stages and then arranging them in order of sequence. Vertical adjustment involves adjusting each stage in terms of time sequence so that the recorded values at the same time are recorded according to their mutual influence relationships.
After preliminary calculations, industrial product data still contains a large amount of historical records. At this point, it is necessary to perform clustering operations on the dataset to reduce the dispersion of data at each stage, thereby facilitating subsequent association rule algorithm calculations. The classic K-Means clustering algorithm [36] is selected to perform clustering operations on each stage separately, with the K value automatically determined using the contour coefficient algorithm based on cohesion and separation.
The contour coefficient is a commonly used method for evaluating clustering effectiveness and can be used to determine the optimal clustering \(K\) value when the optimal clustering \(K\) value is unknown. By using the contour coefficient method to evaluate the clustering effectiveness under different clustering \(K\) values, the optimal \(K\) value can be obtained and selected. The contour coefficient of a sample point \(X_{i}\) is defined as follows: \[\label{GrindEQ__1_} S=\frac{b-a}{\max (a,b)} . \tag{1}\]
Among them, \(a\) is the average distance between \(X_{i}\) and other samples in the same cluster, referred to as the cohesion, and \(b\) is the average distance between \(X_{i}\) and all samples in the nearest cluster, referred to as the separation. After obtaining the contour coefficients of all samples, the average contour coefficient can be obtained by calculating the average value.
The Apriori association rule mining algorithm is briefly introduced in two stages.
Search for all frequent item sets stage:
1) The first step is to generate frequent \(l\_\) item sets. In the initial stage of the algorithm, the item database is scanned, and all item sets are marked as candidate \(l\_\) item sets. At the same time, the support count of each candidate \(l\_\) item set is recorded. Candidate \(l\_\) item sets that meet the minimum support threshold are selected as frequent \(l\_\) item sets.
2) Based on the frequent \(K\_\)item sets generated in the previous step, frequent \((K+l)\_\)item sets are then generated. When generating candidate sets for frequent \((K+l)\_\)item sets, the algorithm achieves this through a connection step that connects two frequent \(K\)-item sets. The result of this step is only a candidate \((K+l)\_\)item set. At this point, it is necessary to rescan the database to obtain the support counts for the \((K+l)\_\)item sets, thereby determining whether the \((K+l)\_\)item sets are frequent item sets. This process is known as the pruning step.
3) Iterate step 2) until no new candidate item sets are generated or the predefined \(K\)-item set is reached, at which point the calculation stops.
Frequent item set generation Strong association rule generation stage:
(1) For each frequent \(K\_\)item set generated in the previous stage, generate association rules \(X\to Y\) using lexicographical order;
(2) Calculate the confidence level \(c\) based on the generated association rules \(X\to Y\). If \(c\) is greater than or equal to the confidence threshold, then this association rule is a strong association rule.
For industrial product process data, the association analysis in this section focuses on the analysis between process clusters rather than between defective processes. Subsequent processes will yield association rules between defective processes.
The parallelization principle of the Apriori algorithm [37] is the same as that of the serial algorithm. The input for the parallelized algorithm is tabular data composed of asymmetric binary variables. Before the algorithm begins mining, identical transactions must first be merged to reduce the computational load. The mining process is also divided into two steps: identifying all frequent item sets and generating strong association rules. Both steps are executed in parallel using data partitioning methods.
By analyzing the relevance of industrial product datasets, setting minimum support and confidence thresholds, and utilizing multi-dimensional association rules based on Apriori to analyze clustering data between any two nodes in the dataset, we identify frequent 2-predicate sets and generate binary association rules between any two defective nodes.
Through analysis, the association degrees between each node are ultimately combined into an association degree matrix. A depth-first traversal is performed on the association degree matrix to identify the strongest association chains, which form the strongest association trees at different nodes.
Now that we have obtained the association rules and association degrees between any two links, we can combine the relationships between the preceding and following items in the data, select the data that conforms to the time series order and has the highest association degree, and obtain the strongest association chain.
The preprocessing of industrial product data provides high-quality data for obtaining association chains, and the acquisition of association chains provides accurate chains for subsequent modeling.
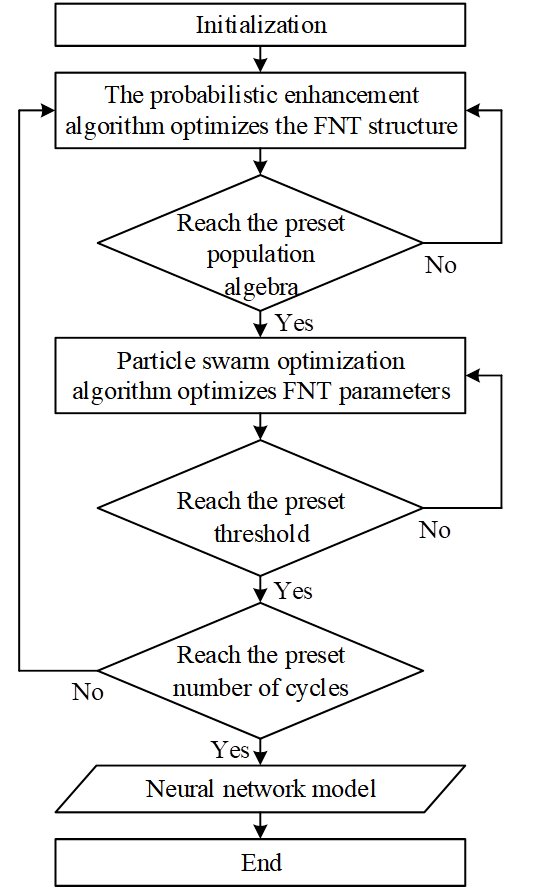
The flexible neural tree network model is a special type of neural network model that does not have intermediate input layers, intermediate layers, or output layers. The connections between layers are non-direct or cross-layer, and features can be adjusted based on prior principles. The feature subset obtained through the algorithm is the optimal feature subset. Experimental verification shows that this network model is more efficient and accurate than ordinary artificial neural network models in solving classification and prediction problems.
The generation of a flexible neural tree network model involves the following steps:
(1) Initialize a probabilistic prototype tree.
(2) Design and optimize the neural network structure using genetic algorithms or probabilistic reinforcement learning algorithms.
(3) Optimize the connection weights of the network model using genetic algorithms or particle swarm optimization methods to obtain an initially optimized neural network model.
(4) Iteratively execute the above steps until the predefined number of iterations is reached or the optimal result is obtained.
The model flowchart is shown in Figure 1.
This paper uses association rule algorithms to obtain the required industrial production process association chains. The AI-based industrial production execution management system models the generated association chains and historical data sets, and finds the optimal parameters suitable for the data set by adjusting the modeling parameters. Finally, the Transformer architecture is used to achieve global optimization of the production process. From model construction and performance evaluation to hardware deployment, this chapter presents a complete closed-loop implementation path from data governance to business applications.
This study systematically integrates diverse information from the production process through state space modeling. Principal component analysis (PCA) is used to reduce the dimensionality of process parameters such as crimping force and contact pressure. The principal components are extracted as key features and input into subsequent models.
At the same time, the current production environment is comprehensively monitored. Production factors such as the proportion of unfinished orders, overall equipment effectiveness (OEE), material inventory levels, and changeover time costs are taken into consideration, and the dynamic state of the production system is mapped to high-dimensional feature vectors. Specifically, these are as follows:
(1) Proportion of unfinished orders: \[\label{GrindEQ__2_} S_{0} =\frac{O_{pending} }{O_{total} } , \tag{2}\] \(O_{pending}\) represents the number of uncompleted orders, and \(O_{total}\) represents the total number of orders. This ratio intuitively reflects the progress of order execution.
(2) Equipment status, overall equipment efficiency: \[\label{GrindEQ__3_} S_{k} =OEE_{k} . \tag{3}\]
Among them, \(OEE_{k}\) represents the comprehensive efficiency of equipment \(k\), which comprehensively reflects the actual production efficiency and utilization rate of the equipment from the dimensions of time utilization, performance, and product quality.
(3) Material status, normalized inventory level: \[\label{GrindEQ__4_} S_{m} =\frac{I_{m} }{I_{\max } } , \tag{4}\] where \(I_{m}\) represents the inventory quantity of material \(m\) and \(I_{\max }\) represents the maximum capacity of material \(m\), this method eliminates the impact of differences in inventory capacity between different materials on the analysis.
(4) Process parameters, changeover time cost: \[\label{GrindEQ__5_} S_{t} =T_{change} , \tag{5}\] where \(O_{pending}\) represents the number of uncompleted orders, and \(O_{total}\) represents the total number of orders; \(OEE_{k}\) is the overall efficiency of device \(k\) reflecting device utilization; \(I_{m}\) is the inventory level of material \(m\) and \(I_{\max }\) is its maximum capacity; Tchange denotes the changeover time cost.
After extracting spatio-temporal features using a Transformer encoder, an action probability distribution is generated, and the reward function is designed as a multi-objective weighted form: \[\label{GrindEQ__6_} R=0.6D+0.3U-0.1E , \tag{6}\] where D is the delivery rate, U is the equipment utilization rate, and E is the energy consumption cost.
Through the two closely related parts of state space coding and decision-making generation mechanism, the intelligent production scheduling model can comprehensively consider numerous factors in the production process to achieve efficient, accurate, and enterprise-specific production scheduling.
The construction of the quality prediction model primarily consists of two main steps: the construction of a multimodal input feature space and the use of a Transformer-based feature extractor and fully connected classifier.
First, to effectively integrate multi-source information, this study constructs a multimodal input feature space. For process parameters, continuous variables such as temperature and cluster force are directly incorporated into the feature system. Signals such as current and vibration generated during equipment operation exhibit temporal characteristics, so they are organized as time series. For surface defect image data, key features such as texture and shape are extracted from the images to convert image data into feature vectors. Through these steps, different types of data are integrated into a unified feature space, laying the foundation for subsequent analysis.
The quality prediction module consists of a Transformer-based feature extractor and a fully connected classifier. The Transformer architecture, leveraging self-attention mechanisms, effectively captures long-term dependencies in time series data, aligning with the processing requirements of production process time-series data. The model inputs include process parameters, equipment operational status signals, and real-time detected surface defect image features. During model operation, the Transformer feature extractor performs deep feature mining on the input data, learning complex relationships between data points. The fully connected classifier then performs classification predictions based on the extracted features, outputting the quality risk probability for each batch of products.
To identify the key factors causing quality issues, this study employs feature importance analysis. By calculating the contribution of each input feature to the prediction results during model training, we determine the factors significantly influencing quality risk to assist in quality control during the production process.
We output the quality risk probability through a fully connected layer: \[\label{GrindEQ__7_} P(y=1/x)=\sigma (w_{p} \cdot MLP(h_{bi} )+b_{p} ) . \tag{7}\]
The loss function uses cross-entropy loss and adds an L2 regularization term to prevent overfitting: \[\label{GrindEQ__8_} L=-\frac{1}{N} \sum _{i=1}^{N}[y_{i} \log \widehat{y}_{i} +(1-y_{i} )]+\lambda \parallel \theta \parallel _{2}^{2} , \tag{8}\] where \(L\) is the total loss, \(N\) is the sample size, and \(\lambda\) is the L2 regularization parameter.
The construction of the equipment health management model includes improving the accuracy of fault diagnosis.
In the equipment health management module, we use the Transformer model to model equipment sensor data. The multi-head attention mechanism of Transformer can capture complex dependencies between different sensors, thereby improving the accuracy of fault diagnosis.
Multi-head attention calculation: \[\label{GrindEQ__9_} Attention(Q,K,V)=softmax\left(\frac{QK^{T} }{\sqrt{d_{k} } } \right)V , \tag{9}\] where, \(Q=XW_{Q} ,K=XW_{K} ,V=XW_{V}\) and \(d_{k}\) denotes the dimension of the key vector.
The AI-based connector production execution management system adopts a layered architecture design, covering the data acquisition layer, network transmission layer, platform processing layer, and application service layer. The hardware and software design selection involves the following steps and considerations:
(1) Requirements analysis
First, clarify the objectives and determine the system functional requirements (such as data acquisition, real-time analysis, model training, etc.), and quantify performance indicators (such as processing delay, concurrent points, storage capacity, etc.).
(2) Scenario adaptation
Distinguish the differentiated requirements of workshop types (e.g., injection molding, stamping, electroplating, etc.) and clarify the scenario requirements of the data collection layer, network transmission layer, platform processing layer, and application service layer.
(3) Performance Matching
Ensure that the selected hardware meets project requirements, such as computational capability requirements (supporting processing of data from over 5,000 concurrent points with data latency \(\mathrm{<}\)200ms), precision and reliability requirements (e.g., sensor precision meeting process requirements such as \(\mathrm{\pm}\)0.01mm for pressure sensors), and data collection error rate control (e.g., production error \(\mathrm{<}\)1.5% in electroplating workshops).
(4) Hardware Selection
Based on the requirements analysis, select appropriate hardware devices. This includes processors, edge devices, sensors, network and storage devices, etc., and comprehensively consider hardware selection from the aspects of requirements analysis, scenario adaptation, performance matching, scalability, and compatibility.
(5) The AI-based connector production execution management system adopts a layered architecture design, covering the data acquisition layer, network transmission layer, platform processing layer, and application service layer. The AI-based connector production execution management system can be implemented using object-oriented programming software.
Due to differences in the units used for data collection, it is necessary to normalize the data so that the input and output values of the neural network uniformly fall within the [0,1] range.
In this experiment, a comparison was conducted between the BP neural network and the flexible neural tree. The input layer and hidden layer of the BP neural network parameter model use the tangent S-shaped function, while the output layer uses a linear function. The training function is the Levenberg-Marquardt BP algorithm training function, with 400 training steps. The prediction results for product production efficiency and NOx emissions in the production chain using the BP neural network and the flexible neural tree network are shown in Tables 1 and 2.
The industrial production process optimization model established using the flexible neural tree network can better predict production data, with the relative errors in predicting product production efficiency and NOx emissions being smaller than those of the ordinary BP neural network. This indicates that the flexible neural tree network has a significant advantage in data modeling and prediction in industrial production process association chains, with the smallest relative error in predicting product production efficiency being only 0.0051%.
| N | Efficiency | NOx emission | ||||
| Actual value | Predictive value | Relative error/% | Actual value | Predictive value | Relative error/% | |
| 1 | 93.0666 | 93.0452 | 0.0230 | 880.28 | 877.65 | 0.2988 |
| 2 | 93.0426 | 93.0750 | 0.0348 | 863.50 | 857.32 | 0.7157 |
| 3 | 93.5232 | 93.4481 | 0.0803 | 932.36 | 943.45 | 1.1895 |
| 4 | 93.4035 | 93.4631 | 0.0638 | 1084.50 | 1065.01 | 1.7971 |
| 5 | 93.7587 | 93.7767 | 0.0192 | 954.98 | 942.33 | 1.3246 |
| 6 | 93.7889 | 93.8237 | 0.0371 | 770.97 | 811.87 | 5.3050 |
| 7 | 93.7242 | 93.7606 | 0.0388 | 740.51 | 738.04 | 0.3336 |
| 8 | 93.8365 | 93.7963 | 0.0428 | 582.30 | 556.87 | 4.3671 |
| 9 | 93.8276 | 93.8636 | 0.0384 | 796.62 | 800.05 | 0.4306 |
| 10 | 94.1794 | 94.1746 | 0.0051 | 728.89 | 736.43 | 1.0345 |
| N | Efficiency | NOx emission | ||||
| Actual value | Predictive value | Relative error/% | Actual value | Predictive value | Relative error/% | |
| 1 | 93.0666 | 92.8635 | 0.2182 | 880.28 | 877.68 | 0.2954 |
| 2 | 93.0426 | 92.6520 | 0.4198 | 863.50 | 857.30 | 0.7180 |
| 3 | 93.5232 | 92.9720 | 0.5894 | 932.36 | 943.49 | 1.1937 |
| 4 | 93.4035 | 93.5593 | 0.1668 | 1084.50 | 1065.00 | 1.7981 |
| 5 | 93.7587 | 92.9142 | 0.9007 | 954.98 | 942.29 | 1.3288 |
| 6 | 93.7889 | 94.1872 | 0.4247 | 770.97 | 811.91 | 5.3102 |
| 7 | 93.7242 | 92.7161 | 1.0756 | 740.51 | 737.94 | 0.3471 |
| 8 | 93.8365 | 93.8262 | 0.0110 | 582.30 | 716.89 | 23.1135 |
| 9 | 93.8276 | 93.7844 | 0.0460 | 796.62 | 800.04 | 0.4293 |
| 10 | 94.1794 | 94.0065 | 0.1836 | 728.89 | 736.42 | 1.0331 |
To validate the effectiveness of the intelligent scheduling model designed in this paper, algorithm verification was conducted through the construction of case studies. In this chapter, three case studies were constructed based on a standard test set and the actual production conditions of an anchor ring manufacturing workshop at a certain anchorage equipment company. Three case studies were selected for construction, with scales of 5\(\mathrm{\times}\)5, 10\(\mathrm{\times}\)10, and 20\(\mathrm{\times}\)20, respectively. These three case studies encompass large, medium, and small scales, thereby better demonstrating the effectiveness of the model.
To highlight the performance advantages of the intelligent scheduling model designed in this chapter, the constructed cases were solved using both the NSGA-II algorithm-based scheduling model and the intelligent scheduling model proposed in this paper. To ensure consistency in the comparison experiments, both models were applied to the constructed cases for 12 iterations, and the means of the 12 results were compared.
| Method | Case scale | Maximum completion time (min) | Equipment utilization/% | Total energy consumption (Kw*h) |
| NSGA-II | 5\(\mathrm{\times}\)5 | 1720 | 42 | 1571 |
| 10\(\mathrm{\times}\)10 | 2366 | 39 | 4154 | |
| 20\(\mathrm{\times}\)20 | 4079 | 32 | 12412 | |
| This model | 5\(\mathrm{\times}\)5 | 1051 | 84 | 1342 |
| 10\(\mathrm{\times}\)10 | 1822 | 78 | 3841 | |
| 20\(\mathrm{\times}\)20 | 3125 | 76 | 11812 |
Table 3 shows the means of the optimization objective values under the NSGA-II algorithm model and the intelligent scheduling model proposed in this paper. In the solution of multi-objective scheduling problems in workshop operations, the intelligent scheduling model designed in this chapter has absolute advantages over traditional multi-objective workshop scheduling models in terms of reducing maximum completion time and improving equipment utilization, due to its features of parallel processing and flexible scheduling unit length. Equipment utilization rates all reached over 70%. In terms of optimizing total workshop energy consumption, reducing maximum completion time can also reduce other energy consumption in the workshop.
This section predicts the categories of two typical industrial products, SPF and HJD, by learning their features. SPF products have seven label categories: wrinkles, Z-shaped scratches, K-shaped scratches, spots, dirt, bumps, and other defects. HJD data has two label categories: qualified and unqualified.
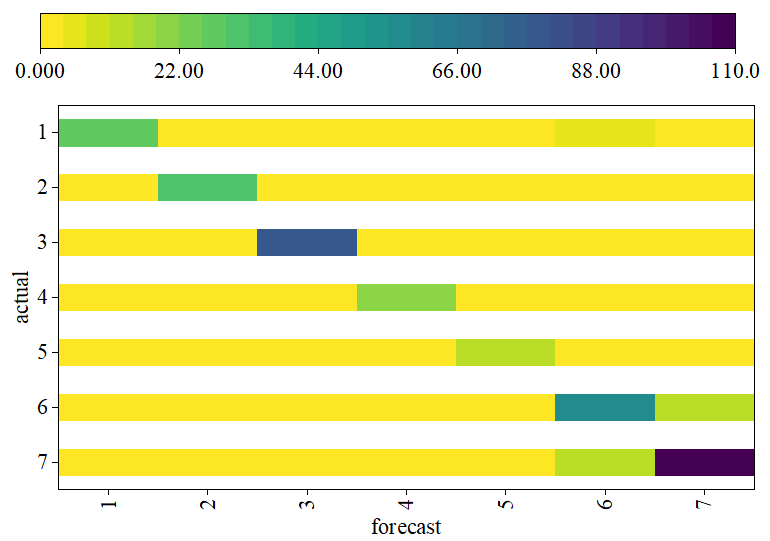
Five-fold cross-validation experiments were conducted on SPF and HJD, with precision and recall rates used as model evaluation metrics. Figure 2 shows the confusion matrix for the optimal model corresponding to SPF. The values on the diagonal represent the number of samples where the prediction matches the actual label. The numbers 1–7 in the figure and table correspond to the seven label categories: wrinkles, Z-shaped scratches, K-shaped scratches, spots, dirt, dents, and other defects. The confusion matrix visually displays the correct and incorrect classifications of the classification model by comparing the model’s predicted results with the actual labels.
The results of five-fold cross-validation on the randomly partitioned SPF dataset are shown in Table 4. In each partition, the model re-learns its parameters, and then the precision, recall, and accuracy of the model are calculated separately for each category in each partition.
| Cross validation | Division1 | Division2 | Division3 | Division4 | Division5 | Mean | |
|---|---|---|---|---|---|---|---|
| 1 | P | 0.7196 | 0.7876 | 0.8081 | 0.6945 | 0.8444 | 0.7708 |
| R | 0.6004 | 0.8665 | 0.7774 | 0.6944 | 0.7716 | 0.7420 | |
| 2 | P | 0.8805 | 0.9247 | 0.8504 | 0.9287 | 0.8380 | 0.8845 |
| R | 0.9486 | 0.8811 | 0.8944 | 0.6664 | 0.9692 | 0.8720 | |
| 3 | P | 0.9529 | 0.9122 | 0.9513 | 0.9363 | 0.9624 | 0.9430 |
| R | 0.9648 | 0.9733 | 0.9873 | 0.9997 | 0.9743 | 0.9799 | |
| 4 | P | 0.9093 | 0.9998 | 0.9096 | 1.0000 | 0.9561 | 0.9549 |
| R | 0.9088 | 0.9333 | 0.9096 | 1.0000 | 0.8800 | 0.9262 | |
| 5 | P | 0.7999 | 0.6998 | 0.9228 | 0.8462 | 0.9996 | 0.8537 |
| R | 0.8000 | 0.7000 | 0.8563 | 1.0000 | 1.0000 | 0.8712 | |
| 6 | P | 0.7712 | 0.7347 | 0.7346 | 0.8228 | 0.7342 | 0.7595 |
| R | 0.8705 | 0.8358 | 0.7074 | 0.8227 | 0.7732 | 0.8019 | |
| 7 | P | 0.7751 | 0.8516 | 0.7956 | 0.7975 | 0.8427 | 0.8124 |
| R | 0.7045 | 0.7626 | 0.7959 | 0.8204 | 0.8102 | 0.7787 | |
| Acc | 0.8259 | 0.8432 | 0.8301 | 0.8375 | 0.8559 | 0.8385 | |
The model performs more accurately in recognizing 3-class (K-type scratches) and 4-class (spots) features, with average precision and recall rates exceeding 90% for both. The recognition precision rate for 4-class features reaches over 95%. However, the model’s recognition capability for the 1-class feature (wrinkles) is relatively weak, with average precision and recall rates both below 80%, and the average recall rate for the 1-class feature is only 74.20%. In terms of accuracy metrics across five classifications, the best and worst performance deviation is 3.00%, with an average accuracy of 83.85%, indicating that the model has good defect prediction capabilities for the SPF dataset.
For the HJD dataset, five-fold cross-validation was still used to randomly divide the dataset for experimentation. The HJD labels are divided into two categories: qualified and unqualified. The prediction results are shown in Table 5.
| Cross validation | Division1 | Division2 | Division3 | Division4 | Division5 | Mean | |
| Qualify | P | 0.9958 | 0.9954 | 0.9984 | 0.9988 | 0.9974 | 0.9972 |
| R | 0.9999 | 0.9989 | 1.0004 | 0.9972 | 0.9979 | 0.9989 | |
| Out of line | P | 0.9993 | 0.8749 | 0.9996 | 0.7782 | 0.8340 | 0.8972 |
| R | 0.6374 | 0.5822 | 0.6664 | 0.8749 | 0.7694 | 0.7061 | |
| Acc | 0.9958 | 0.9942 | 0.9985 | 0.9974 | 0.9953 | 0.9962 | |
Unlike the SPF dataset, the HJD is a random sampling dataset of actual industrial products, with qualified samples accounting for the vast majority. For the task of predicting quality issues, the recall rate for the “unqualified” category is more important, as it reflects the model’s ability to avoid missing problem samples. In the five-fold cross-validation experiments, the worst recall rate for unqualified samples was 58.22%, and the best was 87.49%, with significant variation, averaging 70.61%. This indicates that the model has a certain ability to identify non-compliant samples, but its identification capability is not as strong as its performance on SPF. The imbalanced distribution of data can affect the model’s identification capability to some extent. To optimize the data distribution, data augmentation techniques can be used to expand the minority class samples, thereby improving the model’s performance during the learning process.
To improve fault diagnosis accuracy and training efficiency, it is necessary to expand individual samples. In this paper, samples are segmented, with signals collected from six sensors at 256 time points treated as a single sample, i.e., each row contains 1,536 data points. A training set of 100,000 samples, a test set of 30,000 samples, and a validation set of 10,500 samples are used, with 50 iterations of training.
The equipment health management model proposed in this paper is validated using the ZHS-2 type multi-functional motor flexible rotor test bench. Seven equipment fault operating modes were adopted: Rotor Unbalance 1 (1 screw, bph1), Rotor Unbalance 3 (3 screws, bph3), Rotor Unbalance 5 (5 screws, bph5), Rotor Unbalance 7 (7 screws, bph7), Fan Blade Failure (fjdy), Base Looseness (jzsd), and Normal Mode (zc).
Accuracy is used as the comprehensive evaluation metric. Several common deep learning models are selected as the control group, including the standard multi-head attention (MHA), the equipment health management model proposed in this paper, a one-dimensional convolutional neural network with residual structure, and a window multi-head attention neural network (Win-MHA) that only divides windows without moving feature maps.
Table 6 shows the classification accuracy of the six models on the validation set. Among them, GNB is the Gaussian Naive Bayes classifier. In the table, the fault types include rotor imbalance with 1 loose screw (bph1), rotor imbalance with 3 loose screws (bph3), rotor imbalance with 5 loose screws (bph5), rotor imbalance with 7 loose screws (bph7), loose base (jzsd), fan blade failure (fjdy), and normal mode (zc). From the accuracy rates, it can be seen that the performance of the model proposed in this paper is superior among the six models.
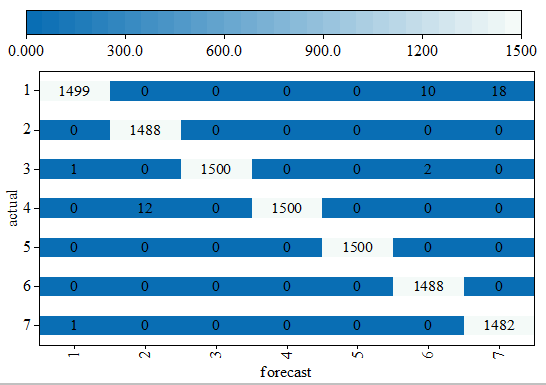
To demonstrate the predictive performance of the equipment health management model on the ZHS-2 rotor platform, a visualization analysis of the confusion matrix of the model on the validation set was conducted, with the results shown in Figure 3.
As shown in Figure 3, there are seven fault states in the validation set, with 1,500 samples for each fault state. With codes 1–7 representing rotor imbalance 1 (1 screw, bph1), rotor imbalance 3 (3 screws, bph3), rotor imbalance 5 (5 screws, bph5), rotor imbalance 7 (7 screws, bph7), fan blade failure (fjdy), base loosening (jzsd), and normal mode (zc), respectively. For faults with actual labels of rotor imbalance with 5 screws (bph5), rotor imbalance with 7 screws (bph7), and loose base (jzsd), the model achieved 100% accurate prediction. This indicates that the equipment health management model proposed in this paper can effectively classify faults in factory production equipment and manage the health of factory equipment.
| Fault type | This model | MHA | Res-1DCNN | ResCNN-MHA | Win-MHA | GNB |
| bph1 | 0.988 | 0.999 | 0.965 | 0.972 | 1.000 | 0.741 |
| bph3 | 1.000 | 1.000 | 0.979 | 0.987 | 1.000 | 0.727 |
| bph5 | 1.000 | 0.919 | 0.970 | 0.923 | 0.959 | 0.939 |
| bph7 | 0.991 | 0.987 | 0.909 | 0.987 | 0.965 | 0.603 |
| jzsd | 1.000 | 1.000 | 1.000 | 0.995 | 1.000 | 0.999 |
| fjdy | 0.995 | 0.984 | 0.899 | 0.977 | 0.985 | 0.744 |
| zc | 1.000 | 0.953 | 0.999 | 0.979 | 0.971 | 0.960 |
| Mean | 0.996 | 0.977 | 0.960 | 0.974 | 0.983 | 0.816 |
Following the implementation of an AI-based industrial production execution management system at Company A, a solid foundation has been laid for optimizing production processes. The optimization of industrial production processes is shown in Table 7. Employees not only improved work efficiency but also optimized the work environment, thereby enhancing the overall level of intelligent production management within the company. The average production and assembly time for major components was reduced, with the most significant optimization effect observed in the production time of the water-cooled pipe routing process. After optimization, the required man-hours were reduced by 66.67% compared to the original production requirements.
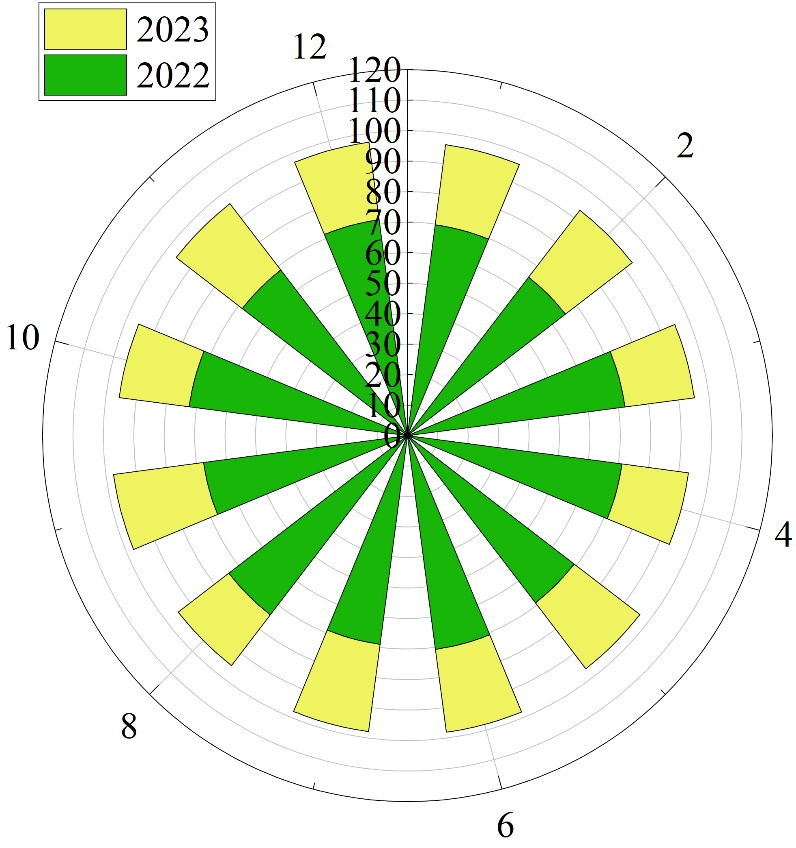
Smart manufacturing requires quality to be built into the manufacturing process, which necessitates robust quality control procedures as a foundation. Additionally, the application of smart manufacturing technologies has been enhanced in critical stages of the production process, thereby improving product quality. As shown in Figure 4, the comparison of the main power circuit board pass rate in 2023, when Company A implemented an AI-based industrial production execution management system, with the main power circuit board pass rate in 2022, when the system was not yet in use, demonstrates that the pass rate of Company A’s main power circuit boards—a key component of its products—has continued to improve, rising from approximately 70% to over 90%. This achievement is attributable to the significant role of smart manufacturing technology in enhancing product quality.
| Number | Process | Primary labor time | Optimize the working hours of the latter |
| 1 | Mainboard manufacturing | 13 | 10 |
| 2 | Silicon controlled manufacturing | 4 | 2 |
| 3 | Reactor manufacturing | 36 | 25 |
| 4 | Water line | 3 | 1 |
| 5 | Circuit line | 6 | 5 |
| 6 | connection | 23 | 20 |
| 7 | Surface treatment | 15 | 12 |
| 8 | Intermediate survey | 14 | 11 |
| 9 | Final package | 11 | 8 |
| 10 | warehousing | 5 | 3 |
This paper designs and constructs an AI-based industrial production execution management system that systematically integrates data analysis, artificial intelligence, and smart manufacturing technologies.
By applying the parallelized Apriori algorithm to identify association chains between industrial production process stages, the system establishes a robust data foundation for understanding the interdependencies between production stages and modeling subsequent industrial production process optimization models. The industrial production process optimization model based on a flexible neural tree network achieves a relative prediction error of just 0.0051% for product production efficiency, demonstrating its effectiveness as a tool for industrial production process optimization.
This paper designed an AI-based industrial production execution management system. The intelligent scheduling model achieves dynamic management of production resources, significantly reducing completion time and demonstrating significant advantages in improving equipment utilization rates, which have all been increased to over 70%. Additionally, using existing data, the prediction accuracy of product quality defects was significantly improved in two typical industrial product datasets: SPF and HJD. The equipment health management model achieved 100% accuracy in predicting fault states such as rotor imbalance with 5 loose screws, rotor imbalance with 7 loose screws, and loose bases in the validation dataset.
The proposed methodology has achieved good results in both production efficiency improvement and product quality control, providing strong support for enterprises to achieve cost reduction and efficiency improvement while enhancing their core competitiveness.