
Although diesel engines continue to be widely used in long-term transportation applications because of their inherent efficiency and reliability, they emit hydrocarbons (HC), carbon monoxide (CO), nitrogen oxides (NOx), and particulate matter (PM), which are hazardous to human health. Therefore, the use of diesel engines must be strictly regulated by governments. To meet these requirements, exhaust after-treatment systems that use diesel oxidation catalysts (DOCs), diesel particulate filters (DPFs), and selective catalytic reduction (SCR) have been widely adopted, but their effectiveness depends significantly on thermal conditions. At low exhaust temperatures, characterized by the termination of urea injection below 200\(^{\circ}\)C and a higher probability of DPF clogging, operational efficiency is severely reduced compared with operation at higher temperatures, to the extent that the performance and service life of the after-treatment system are greatly affected. Thus, precise thermal management is extremely important [1].
Fluid flow through perforated plates is a very important phenomenon in fields such as thermal engineering, mechanical engineering, chemical engineering, civil engineering, nuclear engineering, and aerospace engineering, where it plays important roles in heat-transfer design, flow conditioning, flame control in combustion engines, flow-turbulence control, and the reduction of aerodynamic noise. The hydrodynamic characteristics of these systems are defined by the separation of the flow at the edges of the pores, contraction to the vena contracta, and subsequent re-expansion, which cause severe energy and pressure losses. Although the use of perforated plates is an effective way to reduce flow maldistribution and increase turbulence homogeneity, thereby improving the effectiveness of heat-transfer devices, this advantage comes with a required compromise: increased drag and energy consumption by the system. This, therefore, necessitates the development of empirical models that can precisely predict pressure drops, enabling engineering designs that achieve an optimal trade-off between flow-conditioning quality and energy efficiency [2].
Although comparable optimization issues in after-treatment system design have been covered in other studies, the specific geometric arrangement of components in space has been a major topic of research.
Optimization of SCR inflow uniformity based on CFD simulation.
This study uses Computational Fluid Dynamics (CFD) simulations to optimize inflow uniformity upstream of a Selective Catalytic Reduction (SCR) catalyst carrier by examining six different perforated plate geometries. The authors examined the influence of plate layout and hole size on the velocity distribution and found that high-velocity regions generated by the encircling flow (the exhaust bypassing the plate) severely disrupt homogeneity. The study compared an open plate and an enclosed plate and, based on the design comparison, formulated a trade-off relationship: removing the encircling flow enhances the uniformity index at the expense of an increased pressure drop across the system. The optimal structure was the fully enclosed plate with larger (10 mm) holes, which provided a uniformity index of 98.7%, compared with 97.6% for the original design, with a reasonable increase in pressure drop from 11.20 kPa to 12.09 kPa. This demonstrates that rational sizing and distribution of holes are essential for balancing flow distribution and back-pressure limitations [3].
Optimization Study for Improving Flow Uniformity of Diesel Particulate Filter through CFD Analysis.
In a similar experiment, ANSYS Fluent was used to improve flow homogeneity and pressure drop in a combined Diesel Oxidation Catalyst (DOC) and Diesel Particulate Filter (DPF) after-treatment system. The authors employed the standard \(k\)- turbulence equations and porous-media equations to determine the influence of baffle geometry (diameter and installation distance) and outlet-cone length on the internal flow field. It was found that baffle installation was effective in dispersing the high-velocity central flow toward the periphery, with the best configuration being a 60 mm-diameter baffle placed 60 mm below the inlet, achieving a flow uniformity of 97% compared with 91.8% without a baffle. Moreover, the installation of the baffle stabilized the system pressure drop at a distance of 60 mm or greater. However, the study concluded that increasing the outlet-cone length provided only an insignificant reduction in pressure drop (approximately 160 Pa), while downstream geometric distances had a minimal effect on the total pressure drop relative to the inlet conditions [4].
A Numerical Study of Fluid Flow and Pressure Drop Analysis of Catalytic Converter Using Commercial CFD Code.
This paper presented a numerical analysis using ANSYS CFX to provide information on the nature of fluid flow and pressure drop within a catalytic converter, using a 350 cpsi monolith substrate model represented as a porous medium. The researchers used the Shear Stress Transport (SST) turbulence model to assess the effects of inlet pipe angles (0, 45, and 60 degrees) and substrate segmentation on system performance. The simulations, which were highly consistent with the experimental values (maximum deviation of 2.54%), indicated that although adjustments to the inlet pipe and cone angles had a minimal influence on the overall pressure drop, subdividing the monolith substrate into several sections with air gaps between the layers had a significant impact on back pressure. These results indicate that although inlet geometry affects flow distribution, substrate segmentation is a more effective design method for optimizing pressure drop in the after-treatment system [5].
Transient Flow Uniformity Evolution in Realistic Exhaust Gas After-treatment Systems Using 3D-CFD.
The simulations were performed using transient 3D CFD to study flow and temperature uniformity in the complex geometry of an after-treatment system with a 90\(^{\circ}\) bend. They showed that the rate of evolution of temperature uniformity is much slower than that of velocity uniformity because of thermal inertia and heat losses, making temperature uniformity the rate-determining factor during transient events. The authors concluded that, in practice, traditional single-channel models do not reflect these complex, non-correlated spatiotemporal fluctuations and that more realistic, higher-fidelity modeling is required under transient conditions [6].
The main aim of this research is to determine the effect of the distance between the perforated plate and the Diesel Oxidation Catalyst (DOC) inlet face on the system’s performance. The objective is to identify the optimal plate spacing that provides maximum flow uniformity (FUI) at the catalyst face without imposing an excessive back-pressure penalty from the plate. This is tested under six different operating conditions to accommodate the various inlet mass flow rates and heating temperatures that occur in an internal combustion engine.
In this study, internal pressure and flow analyses were conducted using ANSYS Fluent 2025 R2, a commercial computational fluid dynamics (CFD) software. Specifically, the simulation employed the three-dimensional Reynolds-averaged Navier-Stokes (RANS) equations [4] to analyze the pressure drop, flow velocity, and flow uniformity of the exhaust gas within the after-treatment system. To determine the effects of turbulence on the exhaust gas, a realizable \(k\)-\(\varepsilon\) model was used. Since the diesel oxidation catalyst (DOC) typically has a monolithic honeycomb structure made of ceramic or metal, a porous material model was implemented in Fluent to simulate this structure [7].
The following continuity equation, Eq. (1), momentum equation, Eq. (2), and porous material model, Eq. (3), were used for the analysis.
In Eq. (3), \(\upsilon\) is the flow velocity (m/s), P is the pressure (Pa), \(\rho\) is the fluid density (kg/m3), \(D_{ij}\) is the coefficient of viscous resistance, \(C_{ij}\) is the coefficient of inertial resistance, \(D_{ij}=\frac{1}{K_i}\), and \(C_{ij}=2\beta\) [4].
In Eq. (4), \(k_{eff}\) is the effective conductivity (\(k+k_t\)), where \(k_t\) is the turbulent thermal conductivity, defined according to the turbulence model being used, and \(\overrightarrow{J_j}\) is the diffusion flux of species \(j\). The first three terms on the RHS represent energy transfer due to conduction, species diffusion, and viscous dissipation, respectively. \(S_h\) includes the heat of chemical reaction and any other volumetric heat sources.
Both the unsteady continuity equation and the Navier-Stokes equation are theoretically applicable to the instantaneous motion of most complex turbulent flows [8].
In Eq. (5), \(P_k\) is the production due to velocity shear, \(P_b\) is the production due to buoyancy, and \(S_k\) is a user-defined source.
The uniformity of the exhaust gas flow has a significant influence on the purification efficiency and service life of the exhaust gas after-treatment system. Eq. (6), proposed by Weltens, was used in this research to analyze the flow uniformity of the exhaust gas (\(\sigma\)). A flow uniformity of 1 (100%) represents a perfectly uniform flow distribution, whereas a flow uniformity near zero (0%) represents a highly localized flow. Generally, an exhaust gas purification system design must have a uniformity greater than 0.9 (90%) [9].
where \(A^{1.00}\) is the cross-sectional area of the DOC inlet, \(A^i\) is the cross-sectional area of cell \(i\), \(V_i\) is the local velocity at cell \(i\), and \(V_{avg}\) is the average velocity.
The computational domain was discretized using the Watertight Geometry workflow in ANSYS Fluent. The global body was sized to 9 mm; the geometry was validated to comprise only fluid regions, with no voids. To maintain appropriate flow continuity across the zones, fluid-fluid interfaces were reclassified as internal boundary types, and all wall-wall interfaces were replaced with internal boundaries. To resolve the near-wall region, an inflation layer composed of three boundary layers was used to capture near-wall gradients, with the last-ratio method used to determine the height of the first layer. Polyhedral elements were used to create the final volume mesh. The choice of this topology may be explained by the fact that, in a hexahedral cell with 12 faces, there are six optimal flow directions that achieve a minimum of numerical diffusion. Moreover, the polyhedral mesh structure is computationally economical, using fewer cells to achieve accuracy comparable to that of other meshes [10]. After grid generation, the mesh quality was assessed by evaluating numerical stability and accuracy. A maximum skewness of 0.45 was obtained for the surface mesh, well below the recommended value of 0.7 for high-quality 3D discretization.
Moreover, the overall quality of the mesh was measured in terms of the Orthogonal Quality measure. The highest Orthogonal Quality was found to be 0.11. Considering the requirements of the solver, an Orthogonal Quality value greater than 0.1 ensures that the largest cell skewness does not exceed the critical value of 0.9 in 3D meshes, and therefore the mesh is adequate to avoid divergence when a solution is being obtained.
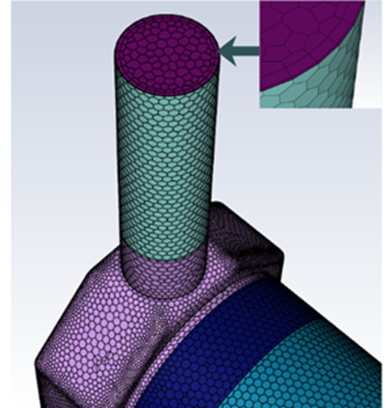
The design configuration considered for this numerical study is an exhaust after-treatment system assembly that consists of four separate fluid regions, as shown in Figure 2: an extended inlet, a mixing chamber where the perforated plate is located, a Diesel Oxidation Catalyst (DOC), and an extended outlet. It starts with a vertical extended inlet (\(\varnothing\) 91 mm) and another larger cylindrical mixing chamber with a diameter of 287 mm and a length of 121 mm. In front of the catalyst section, a perforated plate is placed in this chamber at a definite distance of 10 mm to increase flow uniformity. Below the mixing zone, the geometry changes to the DOC region with a length of 76.2 mm, which leads to an outlet pipe with a diameter of 267 mm and continues over a distance of 600 mm.
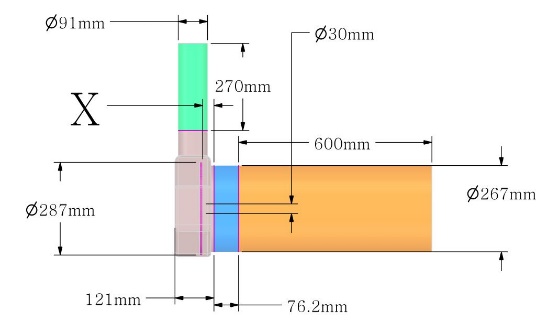
This research paper presents a parametric CFD analysis to optimize the internal geometric arrangement of the exhaust after-treatment system, with particular emphasis on the separation distance “X” between the flow-straightening perforated plate and the inlet face of the Diesel Oxidation Catalyst (DOC), as shown in Figure 2. The distance “X” is used as the main geometrical parameter, with a range of 20 mm to 35 mm in steps of 3 mm (20, 23, 26, 29, 32, and 35 mm). The DOC fluid region is modeled as a porous medium to accurately simulate the hydrodynamic behavior of the catalyst substrate without generating a computationally expensive geometry. Based on available experimental pressure drop data, the viscous and inertial resistance coefficients of the substrate were determined as 5.13\(\times\)10\(^{7}\) [1/m\(^{2}\)] and 19.2 [1/m], respectively. Because the air is exhaust air in this case, its density changes with temperature. Therefore, its density was modeled as an ideal gas, meaning that it follows the ideal gas law. For viscosity, the Sutherland law was used with the three-coefficient method, in which viscosity depends on temperature. The molecular weight of the exhaust gas was also 27.71 kg/kmol.
The performance of both geometries is measured across a coupled set of operating conditions, with 6 mass flow rates ranging from 0.1 to 0.35 kg/s at 0.5 kg/s increments and 6 exhaust gas temperatures ranging from 250 to 500 \(^{\circ}\)C at 50 \(^{\circ}\)C increments. The key research problem is to identify how the distance from the perforated plate influences two competing factors: the uniformity of the flow to the catalyst face and the back-pressure drop between the actual inlet and the DOC inlet. Therefore, the main aim is to determine the optimal distance “X” that maximizes the Flow Uniformity Index (UI) for efficient catalyst conversion while minimizing the pressure drop penalty under all simulated engine operating conditions.
Parametric Study and Baseline Performance: A CFD parametric study compared the hydraulic and mixing performance of the exhaust after-treatment system at different engine loads (0.10 kg/s to 0.35 kg/s) and thermal conditions (250 \(^{0}\)C to 500 \(^{0}\)C). The initial analysis used a baseline spacing of 20 mm, as shown in Table 1. At the nominal operating condition of 0.20 kg/s, which was used as the representative mid-load point at which hydraulic resistance becomes critical, the system had a Flow Uniformity Index (FUI) of 0.845 and a pressure drop of 2.006 kPa. Although this system offered sufficient mixing when the mass flow rate was below 0.20 kg/s, the experimental evidence showed that the pressure drop increase at the 20 mm separator was sharp and non-linear beyond the 0.20 kg/s mark, meaning that the 20 mm separation causes severe flow choking and recirculation regions that inhibit high-rate operation.
Geometric Sensitivity and Comparative Analysis: In an attempt to reduce these hydraulic constraints, a sensitivity analysis was performed by increasing the mixing distance from 20 mm to 35 mm.
| Inputs | Outputs | |||
|---|---|---|---|---|
| Distance (mm) | MFR (kg/s) | Inlet Temperature (\(^{0}\)C) | FUI | Pressure Drop (kPa) |
| 20 mm | 0.1 | 250 | 0.88324 | 0.540 |
| 0.15 | 300 | 0.86466 | 1.160 | |
| 0.2 | 350 | 0.84537 | 2.006 | |
| 0.25 | 400 | 0.82924 | 3.223 | |
| 0.3 | 450 | 0.81618 | 4.744 | |
| 0.35 | 500 | 0.80519 | 6.622 | |
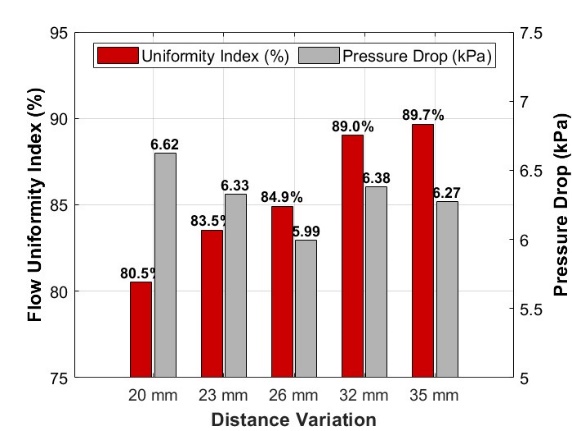
A general comparison of all six geometries shows that mixing length and flow uniformity are strongly positively correlated. At a distance large enough to allow the flow to become established and stabilized, the effect of high-velocity turbulent wakes was diminished. The FUI therefore increased monotonically, from a baseline value of 0.845 at 20 mm to a maximum of 0.913 at 35 mm, as shown in Table 3. More importantly, this improvement in uniformity was not achieved at the expense of increased back pressure. Instead of increasing conventional friction losses, extending the geometry decreased the pressure drop in the 29 mm configuration, as shown in Table 2, achieving a hydraulic sweet spot of 1.928 kPa, the lowest recorded value. The 35 mm configuration was also highly efficient, with a pressure drop of 1.945 kPa.
Quantitative Improvements and Design Selection: The optimization process provided significant performance improvements. The system demonstrated an 8.04% increase in Flow Uniformity by changing the design from the baseline 20 mm configuration to the optimum 35 mm design at the nominal load, thereby exceeding the 0.90 efficiency limit required for high-performance catalytic conversion.
| Inputs | Outputs | |||
|---|---|---|---|---|
| Distance (mm) | MFR (kg/s) | Inlet Temperature (\(^{0}\)C) | FUI | Pressure Drop (kPa) |
| 29 mm | 0.1 | 250 | 0.92147 | 0.538 |
| 0.15 | 300 | 0.90852 | 1.114 | |
| 0.2 | 350 | 0.89933 | 1.928 | |
| 0.25 | 400 | 0.89107 | 3.014 | |
| 0.3 | 450 | 0.88322 | 4.395 | |
| 0.35 | 500 | 0.87521 | 6.074 | |
| Inputs | Outputs | |||
|---|---|---|---|---|
| Distance (mm) | MFR (kg/s) | Inlet Temperature (\(^{0}\)C) | FUI | Pressure Drop (kPa) |
| 35 mm | 0.1 | 250 | 0.92997 | 0.541 |
| 0.15 | 300 | 0.92124 | 1.115 | |
| 0.2 | 350 | 0.91336 | 1.945 | |
| 0.25 | 400 | 0.90696 | 3.066 | |
| 0.3 | 450 | 0.90178 | 4.491 | |
| 0.35 | 500 | 0.89674 | 6.271 | |
At the same time, the system achieved a 3.04% decrease in pressure drop compared with the baseline. This finding validates the above result that the 35 mm distance represents the best design trade-off, as the maximum emission-reduction opportunity is achieved through greater mixing while simultaneously reducing engine back pressure.
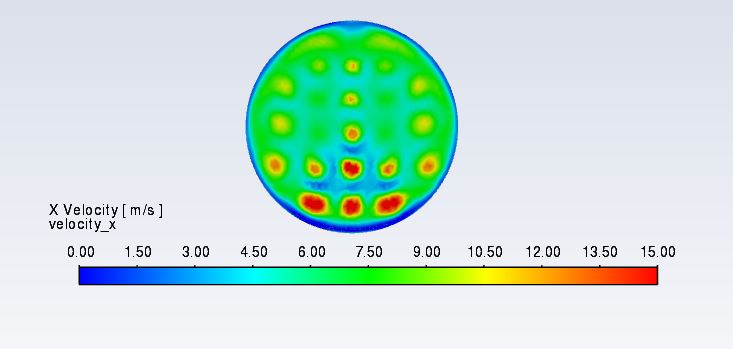
Analysis of Visual Velocity Distribution (Mixing Quality): The visual analysis of velocity distributions based on mixing quality, as visualized in contour plots of the X-direction velocity, provides confirmation of the flow uniformity enhancements observed in the parametric data. Figure 3, at the baseline setup (nominal load of 0.20 kg/s), shows a highly heterogeneous flow field with clear, high-velocity jets emerging from the mixer perforations. The localized velocity cores suggest that the jets cannot fully expand within a 20 mm mixing length, resulting in a non-uniform velocity distribution at the catalyst face and a lower FUI of 84.5%.
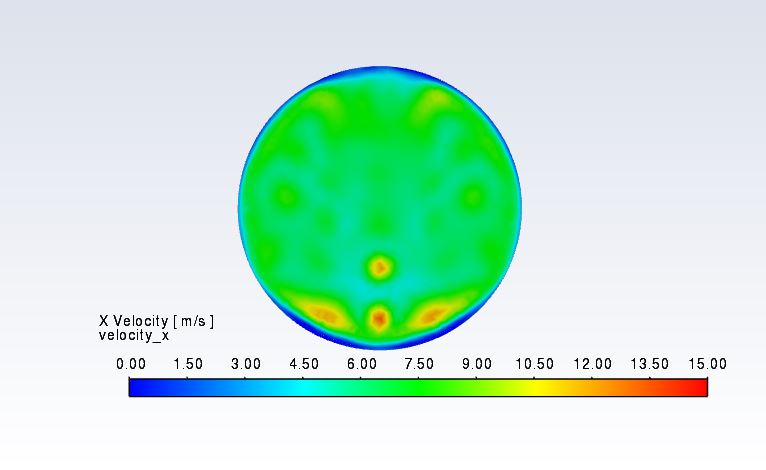
By comparison, extending the mixing distance to the optimal value of 35 mm (Figure 4) shows a much more homogenized flow structure. The turbulent shear layers observed in the baseline case have mostly dissipated, blending into a uniform velocity profile (represented by the dominant green areas). These visual data show that the longer geometry enables the turbulent wake to stabilize more effectively, which is directly linked to the peak FUI of 91.3%. Although a uniformity of 1.0 represents the ideal distribution, the industry standard for exhaust after-treatment systems requires a minimum uniformity index of 90% to achieve optimal catalyst performance and ensure even utilization of the catalyst cross-section [4].
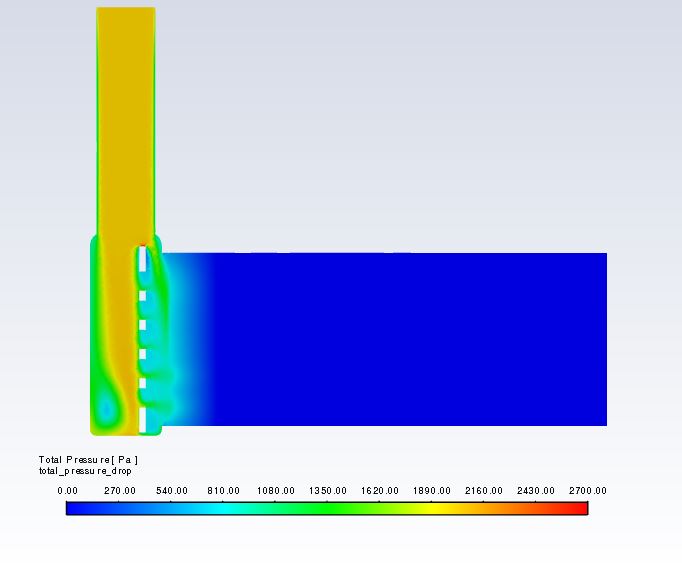
Visual Analysis of Pressure Distribution (Hydraulic Penalty): The overall pressure contours further explain the hydraulic behavior of the after-treatment system. When the 20 mm setup was used (Figure 5), a high-pressure region (marked by red/orange contours) was observed above the perforated plate. This implies a back-pressure bottleneck effect resulting from the proximity of the downstream components, which inhibits flow expansion and causes the flow to become choked.
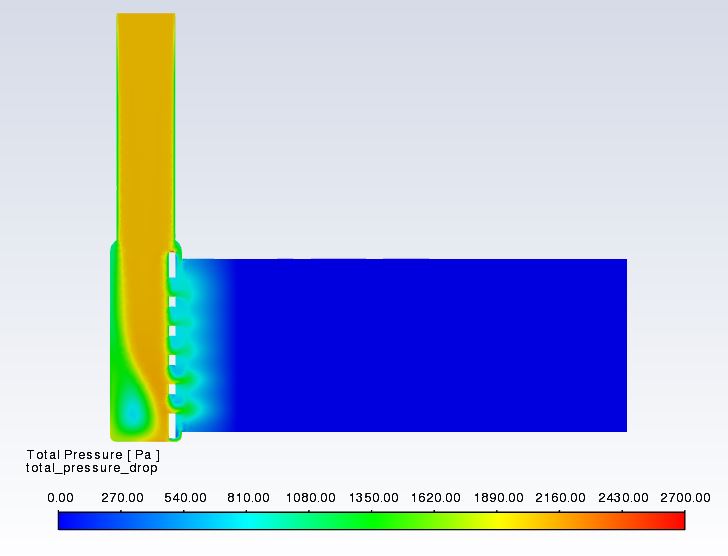
In comparison, at the 35 mm setting (Figure 6), the upstream pressure appears visibly lower and more uniformly distributed. This occurs because the increased distance relieves the aerodynamic blockage, which in turn enables the flow to recover more effectively. The visual pattern thus directly illustrates the nonlinearity of the hydraulic recovery phenomenon observed in the data. Specifically, as the distance increases, the pressure drop decreases from 2.006 kPa to 1.945 kPa. This progression confirms that the added length allows the flow to relax rather than constraining it.
The flow pathline analysis at the nominal load of 0.20 kg/s allows direct visualization of the fluid-dynamic performance of the mixing chamber, complementing the quantitative performance metrics. As shown in Figure 7, the flow structure in the baseline 20 mm configuration has a chaotic and underdeveloped nature, which is exemplified by short-circuiting paths of exhaust gas striking the catalyst face before complete dissipation of the turbulent swirl. This insufficient mixing length leads to recirculation zones and streamlines that concentrate in the center of the duct, further contributing to the poor Flow Uniformity Index (FUI) of 0.845. The improved 35 mm arrangement, as shown in Figure 8, on the other hand, shows a much better-structured flow field, with the longer mixing length allowing the streamlines to spread radially and fill the entire cross-section.
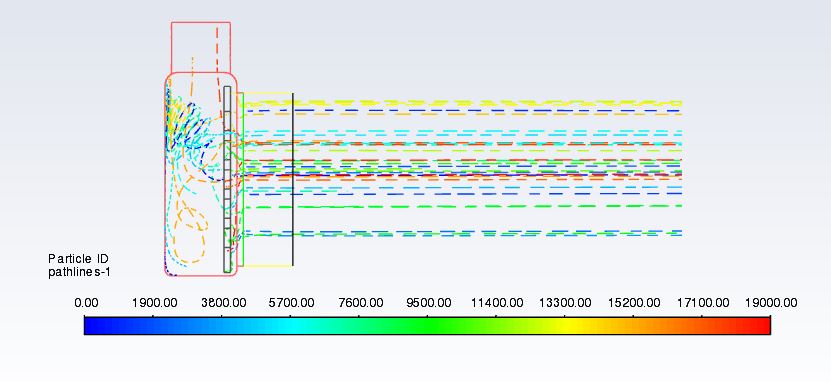
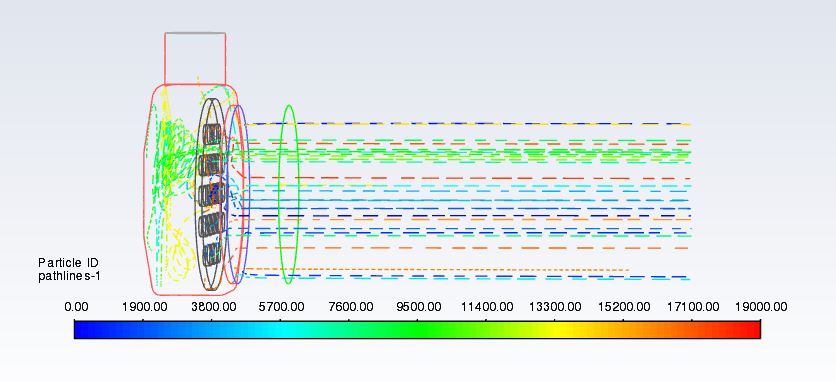
The pathlines in this arrangement appear parallel and evenly distributed as they move toward the outlet, indicating that the high-velocity jets have been successfully integrated into a uniform bulk flow. This visual confirmation shows that the 35 mm geometry provides the required aerodynamic recovery area to stabilize the flow and maximize catalyst surface-area utilization.
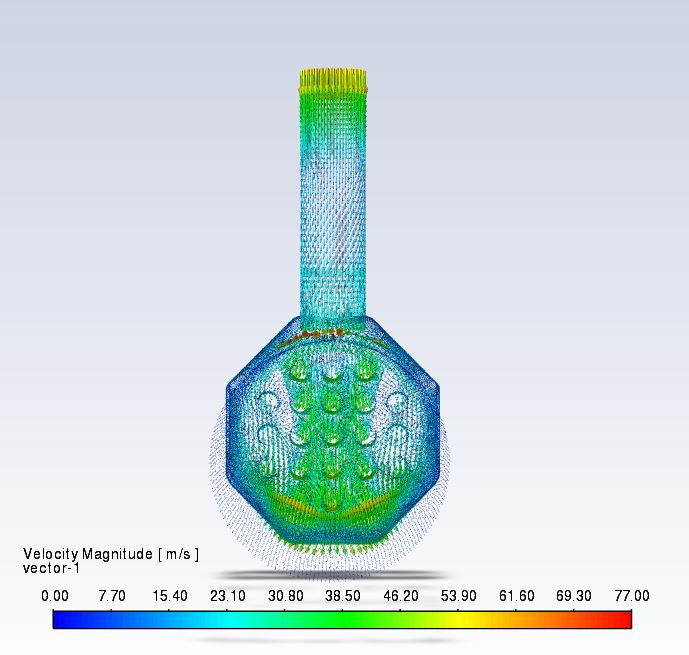
Velocity vector analysis at the nominal load of 0.20 kg/s indicates significant variations in flow directionality and alignment between the baseline and optimized configurations. In the baseline 20 mm design shown in Figure 9, the vector field is highly misaligned with the high-momentum jets, and the recirculation regions clearly trace the duct periphery as the fluid swirls toward the low-pressure areas.
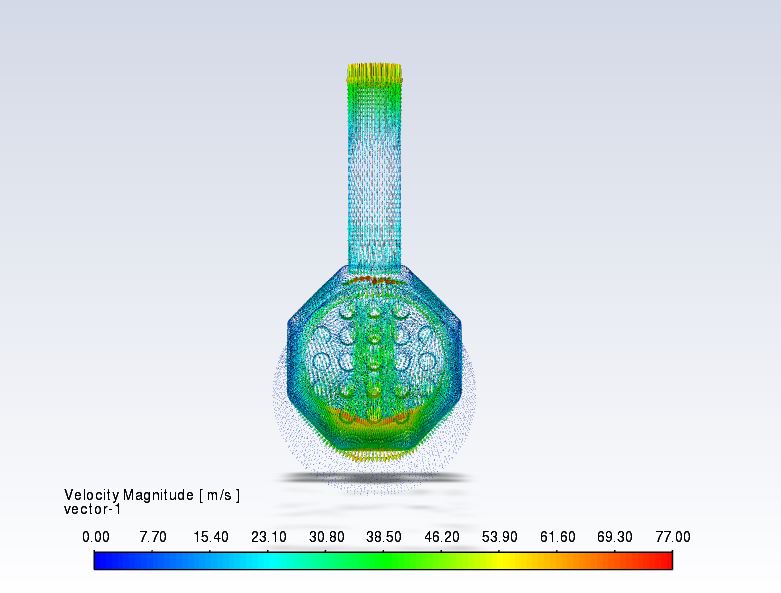
This interlaced vector profile shows that part of the flow strikes the catalyst face at oblique angles, thereby reducing penetration effectiveness. On the other hand, the optimized 35 mm arrangement, as shown in Figure 10, has a much more rectified flow field, which permits the decay of turbulent eddies due to the additional mixing length. This shows that the vectors are mostly axial and perpendicular to the main flow direction, validating the normal entry of exhaust gas into the catalyst channels. Such stabilization reduces hydraulic energy loss and enhances the consistency of the flow distribution, further supporting the 35 mm spacing as the optimal configuration.
This study used computational fluid dynamics (CFD) to optimize the internal geometry of a heavy-duty diesel after-treatment system. The main aim was to determine the optimal separation distance (X) between the flow-straightening perforated plate and the Diesel Oxidation Catalyst (DOC) inlet face. The objective of the optimization was to maximize the Flow Uniformity Index (FUI) and minimize the back-pressure penalty across six engine operating conditions ranging from 0.10–0.35 kg/s.
Optimal Geometric Configuration – A distance of 35 mm was determined to be the optimal distance between the perforated plate and the DOC in the parametric analysis. This design balanced the trade-off between mixing length and hydraulic resistance and performed better than the baseline 20 mm design.
Increased Flow Uniformity – An increase in the mixing distance from 20 mm to 35 mm caused flow homogeneity to increase significantly. At the nominal load of 0.20 kg/s, the Flow Uniformity Index (FUI) increased from a baseline value of 0.845 to 0.9132. This represents a measured increase of 8.04%, allowing the system to exceed the critical industry value of 0.90 required for high-performance conversion [4].
Hydraulic Resistance and Back Pressure – In direct contrast to the expectation that an increase in length would result in increased resistance, it was found that the optimized 35 mm geometry was able to reduce the pressure drop by 3.04% relative to the pressure drop observed at the baseline. The baseline pressure drop was 2.006 kPa and was reduced to 1.945 kPa in the optimized configuration. The qualitative pressure contours showed that, as the distance increased, the bottlenecks upstream of the plate were relieved, allowing the flow to expand more efficiently and reducing aerodynamic blockage.
Flow Field Stabilization – The qualitative examination of the pathlines and velocity vectors showed that the 35 mm arrangement was successful in eliminating the turbulent recirculation regions and high-velocity jets visible in the 20 mm baseline configuration. The rectified field generated by the optimized design was an axial flow field, with the velocity vectors oriented perpendicular to the catalyst face to allow deep and even penetration of the exhaust gas into the substrate channels.
In conclusion, for this particular configuration of the after-treatment system, the most appropriate design solution is to increase the perforated plate-to-DOC distance to 35 mm. It provides the required residence time for turbulent wake dissipation, which ensures maximum catalyst utilization and longevity while also reducing the engine back-pressure load. These results can be used to provide useful recommendations when designing compact and high-efficiency after-treatment systems that comply with strict emission regulations.
Although this study determines the sensitivity of the Flow Uniformity Index (FUI) and pressure drop to the axial location of the perforated plate, the following areas are suggested for extending the current study and optimizing the operation of the Diesel Oxidation Catalyst (DOC):
Transient Flow and Thermal Analysis – In the future, the focus needs to move toward transient 3D-CFD simulations that consider performance under standard driving cycles (e.g., WLTP). This should also incorporate an associated thermal solver to examine the light-off behavior of the catalyst and ensure that the flow straightening achieved by the perforated plate can be translated into an even distribution of thermal activation across the monolith.
Combined Chemical Kinetics – In order to bridge the gap between environmental compliance and fluid dynamics, future models would benefit from incorporating surface chemistry and species transport. The incorporation of kinetic processes will enable direct determination of the relationship between particular FUI values and the actual CO and HC conversion efficiencies, thereby confirming the hypothesis of the hydraulic sweet spot determined in this work.
Advanced Geometry Optimization – Research on non-uniform perforated plate structures is proposed. This involves evaluating variable porosity, where the density of holes is graded radially to improve the distribution of the high-velocity central jet. In addition, further investigation into the effects of monolith substrate segmentation and various baffle shapes may yield additional reductions in the overall system back pressure.
All authors contributed equally in this manuscript. All authors have read and approved the final version of the manuscript.
This research received no external funding.
The data supporting the findings of this study, including the numerical simulation results, are available from the corresponding author upon reasonable request.
The authors declare that they have no conflicts of interest.
The authors used ChatGPT (OpenAI) solely to correct grammar, spelling, and language-related issues in the manuscript. No scientific content, data, results, analyses, or conclusions were generated using AI. The authors reviewed all revisions and take full responsibility for the final manuscript.